 ビックカメラ
【東証プライム:3048】「小売業」
ビックカメラ
【東証プライム:3048】「小売業」
 へ投稿
へ投稿
主な指標
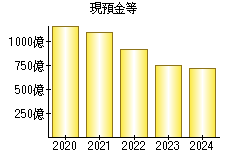
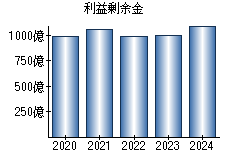
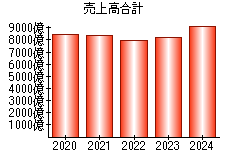
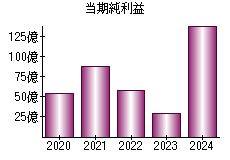
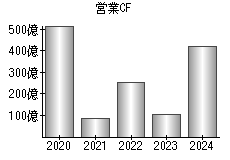
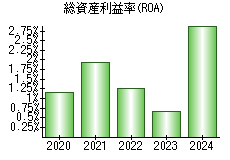
【見方】一般に、経営状態が良い会社はグラフが右肩上がりになります。
| 決算年月日 | 2020年8月31日 | 2021年8月31日 | 2022年8月31日 | 2023年8月31日 | 2024年8月31日 |
|---|---|---|---|---|---|
| 現預金等 | 117,211 | 108,973 | 91,081 | 75,135 | 71,396 |
| 利益剰余金 | 98,718 | 106,134 | 98,936 | 99,649 | 110,263 |
| 売上高 | 847,905 | 834,060 | 792,368 | 815,560 | 922,572 |
| 当期純利益 | 5,450 | 8,761 | 5,766 | 2,938 | 13,909 |
| 営業活動によるキャッシュフロー | 52,004 | 8,388 | 25,318 | 10,297 | 41,994 |
| 総資産利益率(ROA) | 1.15% | 1.93% | 1.26% | 0.65% | 2.91% |
※単位:百万円
PR
- 検索
- 業種別業績ランキング