 ヒロタグループホールディングス
【名証ネクスト:3346】「小売業」
ヒロタグループホールディングス
【名証ネクスト:3346】「小売業」
 へ投稿
へ投稿
主な指標
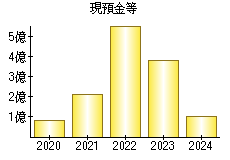
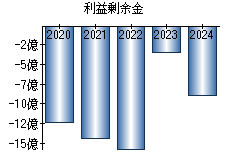
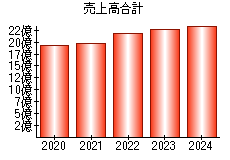
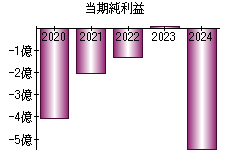
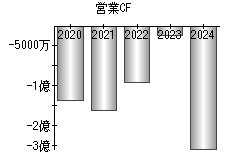
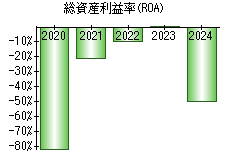
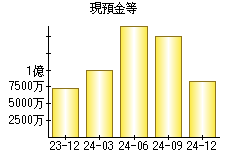
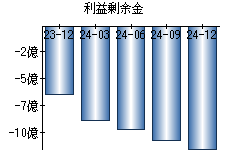
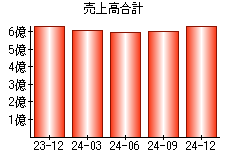
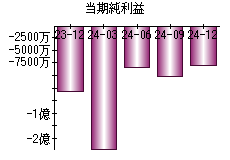
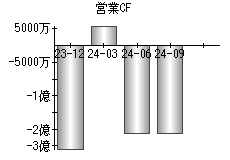
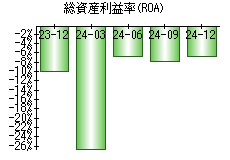
【見方】一般に、経営状態が良い会社はグラフが右肩上がりになります。
| 決算年月日 | 2023年12月31日 | 2024年3月31日 | 2024年6月30日 | 2024年9月30日 | 2024年12月31日 |
|---|---|---|---|---|---|
| 現預金等 | 73 | 100 | 168 | 150 | 82 |
| 利益剰余金 | -644 | -890 | -975 | -1,077 | -1,156 |
| 売上高 | 631 | 605 | 593 | 603 | 637 |
| 当期純利益 | -132 | -246 | -85 | -102 | -80 |
| 営業活動によるキャッシュフロー | -309 | 61 | -262 | -262 | - |
| 総資産利益率(ROA) | -9.98% | -26.61% | -6.66% | -7.78% | -6.68% |
※単位:百万円
PR
- 検索
- 業種別業績ランキング