 パレモ・ホールディングス
【東証スタンダード:2778】「小売業」
パレモ・ホールディングス
【東証スタンダード:2778】「小売業」
 へ投稿
へ投稿
主な指標
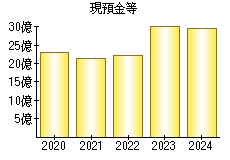
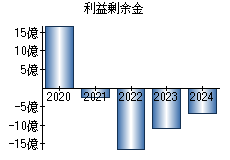
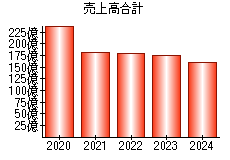
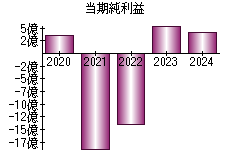
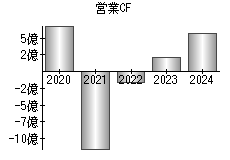
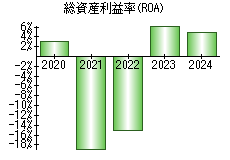
【見方】一般に、経営状態が良い会社はグラフが右肩上がりになります。
| 決算年月日 | 2020年2月20日 | 2021年2月20日 | 2022年2月20日 | 2023年2月20日 | 2024年2月20日 |
|---|---|---|---|---|---|
| 現預金等 | 2,294 | 2,136 | 2,210 | 3,045 | 2,945 |
| 利益剰余金 | 1,699 | -242 | -1,638 | -1,099 | -687 |
| 売上高 | 24,084 | 18,257 | 17,907 | 17,514 | 15,941 |
| 当期純利益 | 350 | -1,881 | -1,394 | 562 | 412 |
| 営業活動によるキャッシュフロー | 697 | -1,156 | -159 | 207 | 566 |
| 総資産利益率(ROA) | 3.00% | -18.82% | -15.12% | 6.41% | 4.89% |
※単位:百万円
PR
- 検索
- 業種別業績ランキング