 バナーズ
【東証スタンダード:3011】「小売業」
バナーズ
【東証スタンダード:3011】「小売業」
 へ投稿
へ投稿
主な指標
【見方】一般に、経営状態が良い会社はグラフが右肩上がりになります。
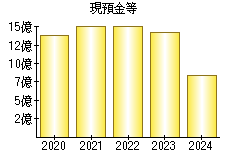
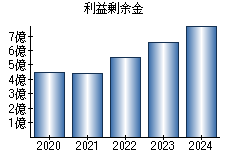
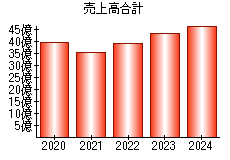
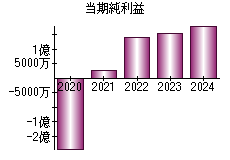
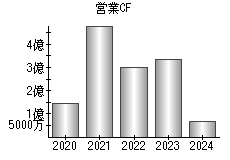
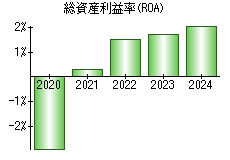
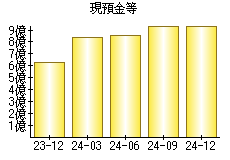
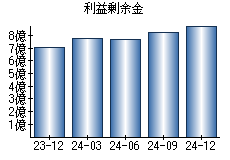
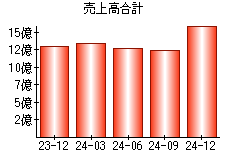
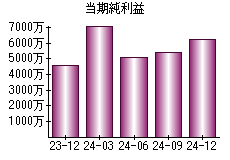
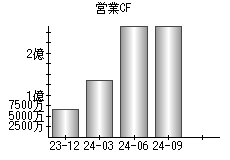
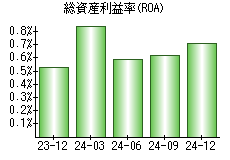
| 決算年月日 | 2023年12月31日 | 2024年3月31日 | 2024年6月30日 | 2024年9月30日 | 2024年12月31日 |
|---|---|---|---|---|---|
| 現預金等 | 629 | 837 | 857 | 936 | 943 |
| 利益剰余金 | 705 | 777 | 767 | 821 | 884 |
| 売上高 | 1,303 | 1,345 | 1,266 | 1,237 | 1,604 |
| 当期純利益 | 46 | 72 | 51 | 54 | 62 |
| 営業活動によるキャッシュフロー | 66 | 136 | 268 | 268 | - |
| 総資産利益率(ROA) | 0.53% | 0.85% | 0.59% | 0.62% | 0.71% |
※単位:百万円
PR
- 検索
- 業種別業績ランキング