 ネオマーケティング
【東証スタンダード:4196】「情報・通信業」
ネオマーケティング
【東証スタンダード:4196】「情報・通信業」
 へ投稿
へ投稿
主な指標
【見方】一般に、経営状態が良い会社はグラフが右肩上がりになります。
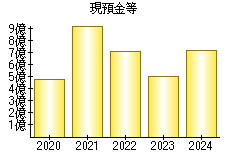
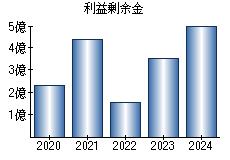
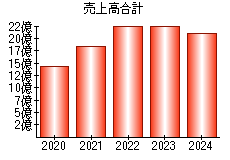
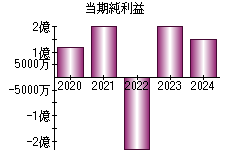
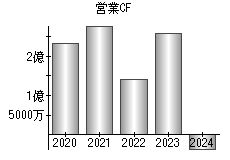
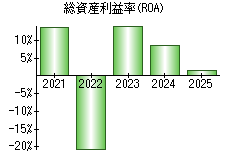
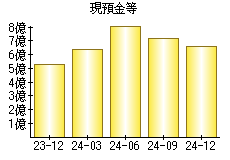
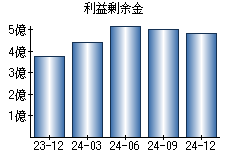
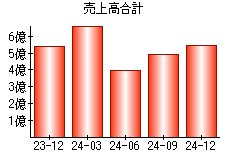
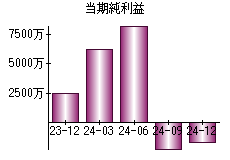
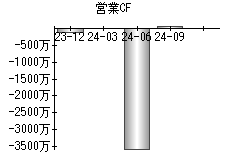
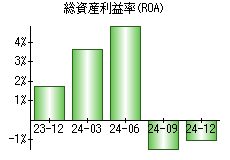
| 決算年月日 | 2023年12月31日 | 2024年3月31日 | 2024年6月30日 | 2024年9月30日 | 2024年12月31日 |
|---|---|---|---|---|---|
| 現預金等 | 526 | 636 | 816 | 714 | 657 |
| 利益剰余金 | 377 | 440 | 523 | 500 | 483 |
| 売上高 | 541 | 667 | 397 | 493 | 545 |
| 当期純利益 | 24 | 63 | 83 | -23 | -17 |
| 営業活動によるキャッシュフロー | -1 | 0 | -36 | 1 | - |
| 総資産利益率(ROA) | 1.73% | 3.61% | 4.88% | -1.48% | -1.03% |
※単位:百万円
PR
- 検索
- 業種別業績ランキング