 ディー・エル・イー
【東証スタンダード:3686】「情報・通信業」
ディー・エル・イー
【東証スタンダード:3686】「情報・通信業」
 へ投稿
へ投稿
主な指標
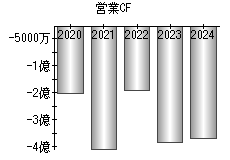
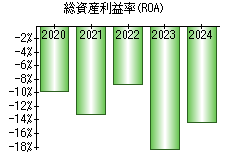
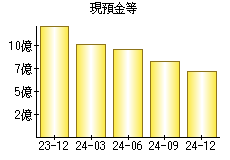
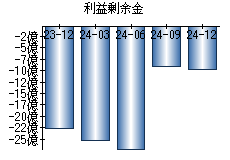
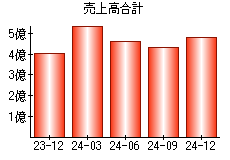
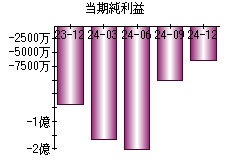
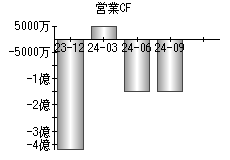
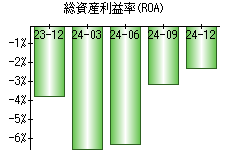
【見方】一般に、経営状態が良い会社はグラフが右肩上がりになります。
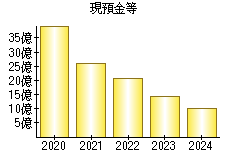
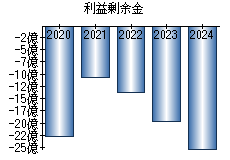
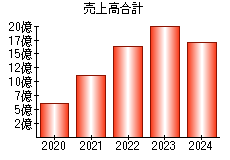
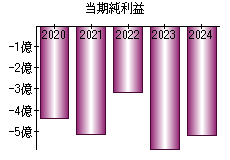
| 決算年月日 | 2020年3月31日 | 2021年3月31日 | 2022年3月31日 | 2023年3月31日 | 2024年3月31日 |
|---|---|---|---|---|---|
| 現預金等 | 3,954 | 2,594 | 2,076 | 1,422 | 1,007 |
| 利益剰余金 | -2,276 | -1,077 | -1,382 | -1,964 | -2,526 |
| 売上高 | 598 | 1,117 | 1,640 | 2,021 | 1,706 |
| 当期純利益 | -438 | -515 | -315 | -582 | -521 |
| 営業活動によるキャッシュフロー | -252 | -459 | -241 | -435 | -418 |
| 総資産利益率(ROA) | -9.81% | -13.22% | -8.81% | -18.29% | -14.39% |
※単位:百万円
PR
- 検索
- 業種別業績ランキング