 ティーケーピー
【東証グロース:3479】「不動産業」
ティーケーピー
【東証グロース:3479】「不動産業」
 へ投稿
へ投稿
主な指標
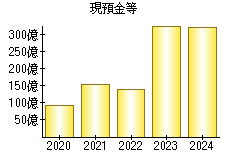
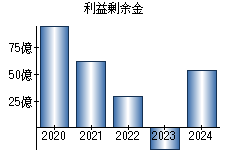
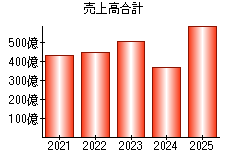
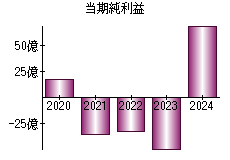
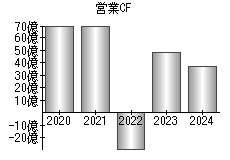
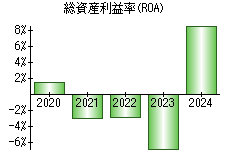
【見方】一般に、経営状態が良い会社はグラフが右肩上がりになります。
| 決算年月日 | 2020年2月29日 | 2021年2月28日 | 2022年2月28日 | 2023年2月28日 | 2024年2月29日 |
|---|---|---|---|---|---|
| 現預金等 | 9,131 | 15,195 | 13,931 | 32,661 | 32,069 |
| 利益剰余金 | 9,650 | 6,203 | 2,967 | -1,972 | 5,382 |
| 売上高 | 54,343 | 43,138 | 44,685 | 50,504 | 36,545 |
| 当期純利益 | 1,741 | -3,501 | -3,210 | -4,935 | 6,975 |
| 営業活動によるキャッシュフロー | 6,990 | 7,022 | -2,890 | 4,849 | 3,722 |
| 総資産利益率(ROA) | 1.48% | -2.99% | -2.88% | -6.85% | 8.75% |
※単位:百万円
PR
- 検索
- 業種別業績ランキング