 ソーシャルワイヤー
【東証グロース:3929】「情報・通信業」
ソーシャルワイヤー
【東証グロース:3929】「情報・通信業」
 へ投稿
へ投稿
主な指標
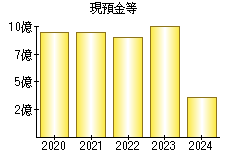
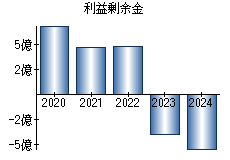
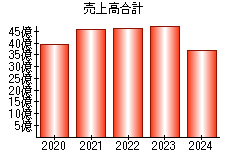
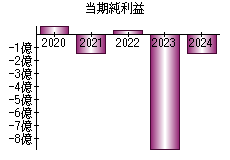
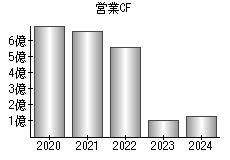
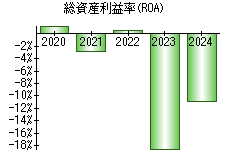
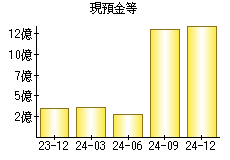
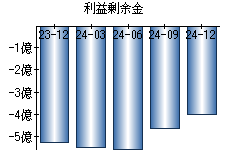
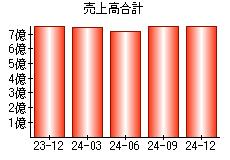
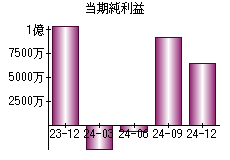
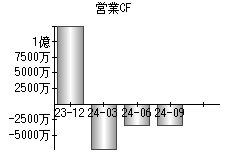
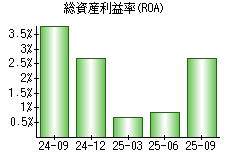
【見方】一般に、経営状態が良い会社はグラフが右肩上がりになります。
| 決算年月日 | 2020年3月31日 | 2021年3月31日 | 2022年3月31日 | 2023年3月31日 | 2024年3月31日 |
|---|---|---|---|---|---|
| 現預金等 | 943 | 943 | 899 | 1,015 | 354 |
| 利益剰余金 | 693 | 472 | 477 | -400 | -549 |
| 売上高 | 3,925 | 4,566 | 4,630 | 4,770 | 3,670 |
| 当期純利益 | 73 | -144 | 29 | -877 | -146 |
| 営業活動によるキャッシュフロー | 700 | 659 | 558 | 100 | 126 |
| 総資産利益率(ROA) | 1.45% | -2.78% | 0.58% | -18.56% | -10.96% |
※単位:百万円
PR
- 検索
- 業種別業績ランキング