 スーパーバリュー
【東証スタンダード:3094】「小売業」
スーパーバリュー
【東証スタンダード:3094】「小売業」
 へ投稿
へ投稿
主な指標
【見方】一般に、経営状態が良い会社はグラフが右肩上がりになります。
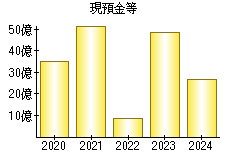
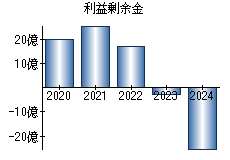
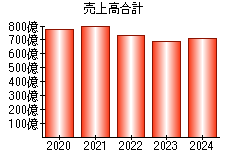
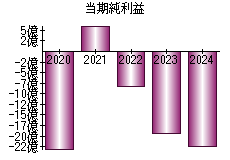
| 決算年月日 | 2020年2月29日 | 2021年2月28日 | 2022年2月28日 | 2023年2月28日 | 2024年2月29日 |
|---|---|---|---|---|---|
| 現預金等 | 3,482 | 5,196 | 877 | 4,828 | 2,681 |
| 利益剰余金 | 1,986 | 2,580 | 1,688 | -270 | -2,527 |
| 売上高 | 77,000 | 80,080 | 72,420 | 68,172 | 70,434 |
| 当期純利益 | -2,305 | 626 | -829 | -1,937 | -2,258 |
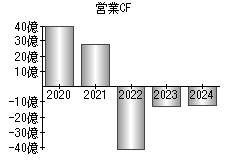
| 営業活動によるキャッシュフロー | 4,038 | 2,746 | -4,091 | -1,299 | -1,243 |
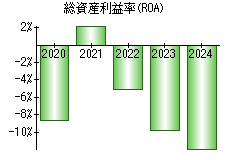
| 総資産利益率(ROA) | -8.64% | 2.33% | -5.07% | -9.79% | -11.94% |
※単位:百万円
PR
- 検索
- 業種別業績ランキング