 シリウスビジョン
【東証スタンダード:6276】「電気機器」
シリウスビジョン
【東証スタンダード:6276】「電気機器」
 へ投稿
へ投稿
主な指標
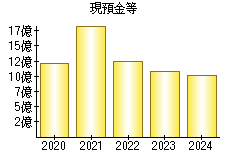
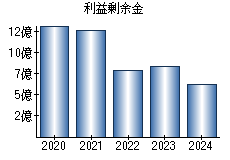
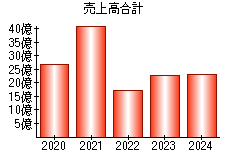
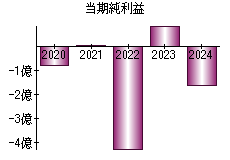
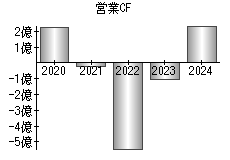
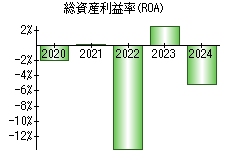
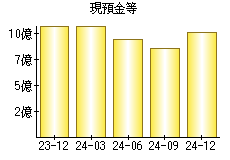
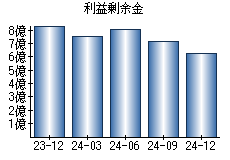
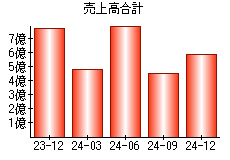
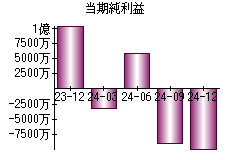
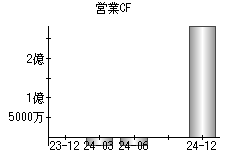
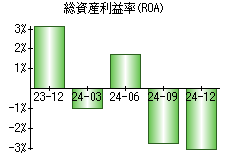
【見方】一般に、経営状態が良い会社はグラフが右肩上がりになります。
| 決算年月日 | 2020年12月31日 | 2021年12月31日 | 2022年12月31日 | 2023年12月31日 | 2024年12月31日 |
|---|---|---|---|---|---|
| 現預金等 | 1,205 | 1,843 | 1,248 | 1,083 | 1,015 |
| 利益剰余金 | 1,333 | 1,268 | 795 | 838 | 627 |
| 売上高 | 2,692 | 4,138 | 1,729 | 2,287 | 2,315 |
| 当期純利益 | -78 | 7 | -425 | 90 | -163 |
| 営業活動によるキャッシュフロー | 224 | -20 | -545 | -106 | 241 |
| 総資産利益率(ROA) | -1.94% | 0.18% | -13.66% | 2.69% | -5.09% |
※単位:百万円
PR
- 検索
- 業種別業績ランキング