 サイトリ細胞研究所
【東証スタンダード:3750】「情報・通信業」
サイトリ細胞研究所
【東証スタンダード:3750】「情報・通信業」
 へ投稿
へ投稿
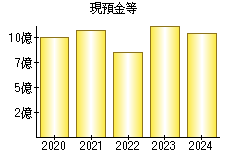
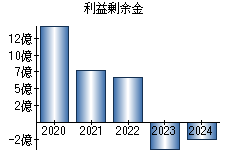
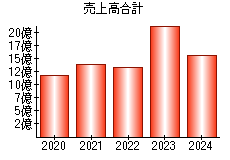
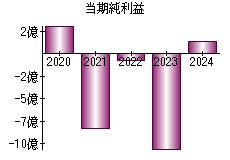
主な指標
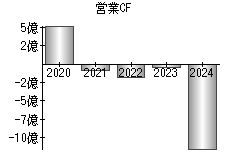
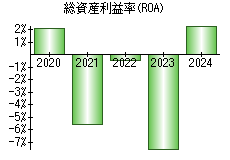
【見方】一般に、経営状態が良い会社はグラフが右肩上がりになります。
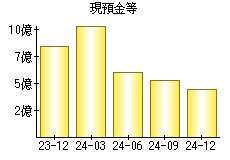
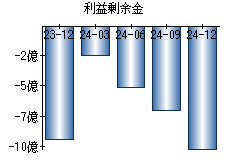
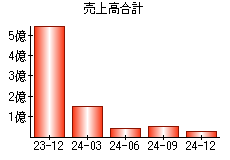
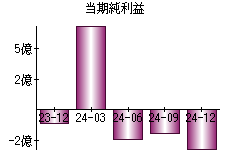
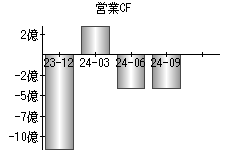
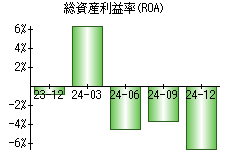
| 決算年月日 | 2023年12月31日 | 2024年3月31日 | 2024年6月30日 | 2024年9月30日 | 2024年12月31日 |
|---|---|---|---|---|---|
| 現預金等 | 836 | 1,038 | 601 | 522 | 444 |
| 利益剰余金 | -938 | -247 | -509 | -699 | -1,018 |
| 売上高 | 549 | 149 | 40 | 52 | 25 |
| 当期純利益 | -109 | 690 | -243 | -190 | -319 |
| 営業活動によるキャッシュフロー | -1,152 | 367 | -411 | -411 | - |
| 総資産利益率(ROA) | -0.80% | 6.43% | -4.52% | -3.69% | -6.53% |
※単位:百万円
PR
- 検索
- 業種別業績ランキング