 グリー
【東証プライム:3632】「情報・通信業」
グリー
【東証プライム:3632】「情報・通信業」
 へ投稿
へ投稿
主な指標
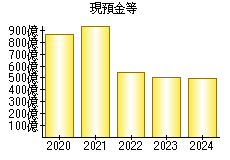
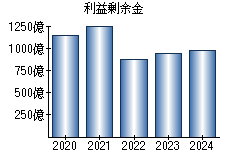
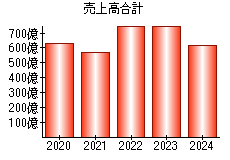
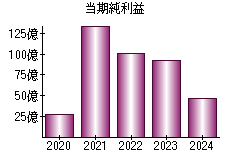
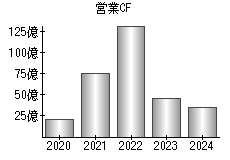
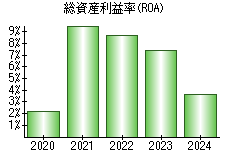
【見方】一般に、経営状態が良い会社はグラフが右肩上がりになります。
| 決算年月日 | 2020年6月30日 | 2021年6月30日 | 2022年6月30日 | 2023年6月30日 | 2024年6月30日 |
|---|---|---|---|---|---|
| 現預金等 | 87,018 | 94,824 | 54,624 | 50,293 | 49,788 |
| 利益剰余金 | 114,550 | 126,166 | 86,810 | 94,144 | 96,930 |
| 売上高 | 62,665 | 56,766 | 74,906 | 75,440 | 61,309 |
| 当期純利益 | 2,710 | 13,533 | 10,122 | 9,277 | 4,629 |
| 営業活動によるキャッシュフロー | 2,032 | 7,528 | 13,218 | 4,591 | 3,501 |
| 総資産利益率(ROA) | 2.14% | 9.57% | 8.67% | 7.43% | 3.59% |
※単位:百万円
PR

- 検索
- 業種別業績ランキング