 クリーマ
【東証グロース:4017】「情報・通信業」
クリーマ
【東証グロース:4017】「情報・通信業」
 へ投稿
へ投稿
主な指標
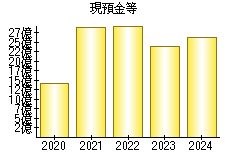
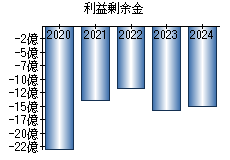
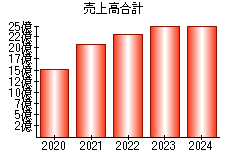
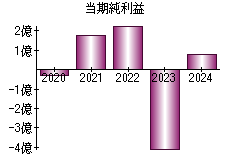
【見方】一般に、経営状態が良い会社はグラフが右肩上がりになります。
| 決算年月日 | 2020年2月29日 | 2021年2月28日 | 2022年2月28日 | 2023年2月28日 | 2024年2月29日 |
|---|---|---|---|---|---|
| 現預金等 | 1,403 | 2,885 | 2,954 | 2,375 | 2,632 |
| 利益剰余金 | -2,295 | -1,403 | -1,172 | -1,580 | -1,501 |
| 売上高 | 1,518 | 2,062 | 2,295 | 2,500 | 2,509 |
| 当期純利益 | -28 | 178 | 231 | -408 | 79 |
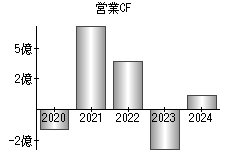
| 営業活動によるキャッシュフロー | -165 | 689 | 394 | -321 | 113 |
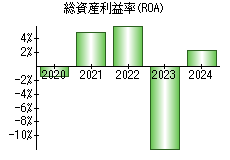
| 総資産利益率(ROA) | -1.44% | 4.83% | 5.93% | -11.89% | 2.21% |
※単位:百万円
PR
- 検索
- 業種別業績ランキング