 カイオム・バイオサイエンス
【東証グロース:4583】「医薬品」
カイオム・バイオサイエンス
【東証グロース:4583】「医薬品」
 へ投稿
へ投稿
主な指標
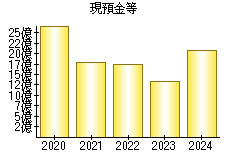
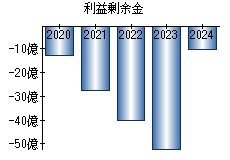
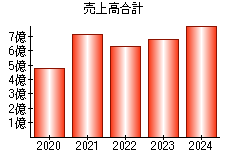
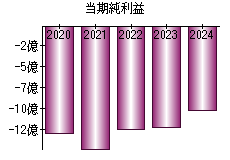
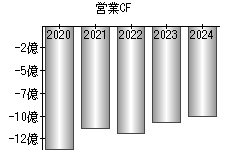
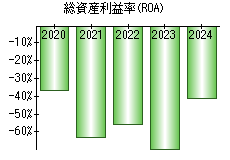
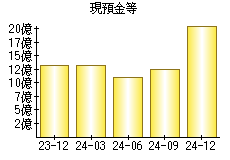
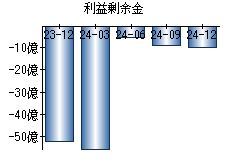
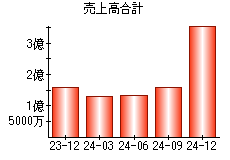
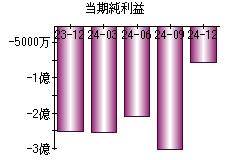
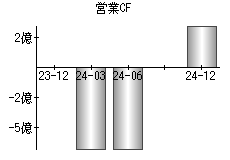
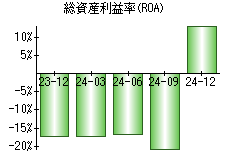
【見方】一般に、経営状態が良い会社はグラフが右肩上がりになります。
| 決算年月日 | 2020年12月31日 | 2021年12月31日 | 2022年12月31日 | 2023年12月31日 | 2024年12月31日 |
|---|---|---|---|---|---|
| 現預金等 | 2,686 | 1,791 | 1,727 | 1,326 | 2,063 |
| 利益剰余金 | -1,265 | -2,738 | -4,003 | -5,219 | -1,011 |
| 売上高 | 481 | 713 | 631 | 682 | 781 |
| 当期純利益 | -1,294 | -1,480 | -1,243 | -1,220 | -1,021 |
| 営業活動によるキャッシュフロー | -1,360 | -1,131 | -1,191 | -1,069 | -1,001 |
| 総資産利益率(ROA) | -37.02% | -63.26% | -56.10% | -69.66% | -41.35% |
※単位:百万円
PR
- 検索
- 業種別業績ランキング