 エフ・コード
【東証グロース:9211】「サービス業」
エフ・コード
【東証グロース:9211】「サービス業」
 へ投稿
へ投稿
主な指標
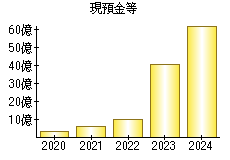
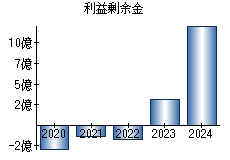
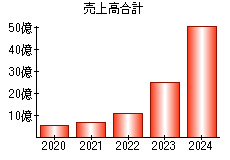
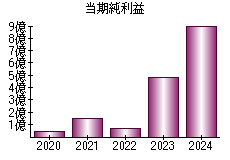
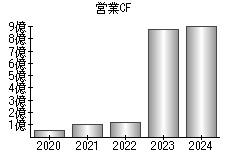
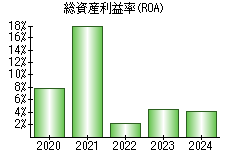
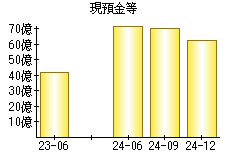
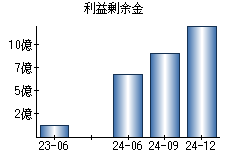
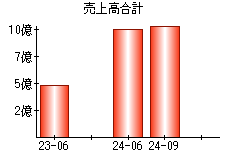
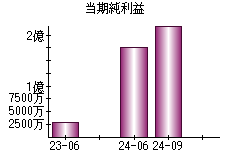
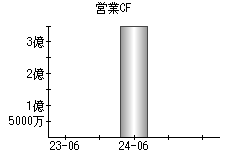
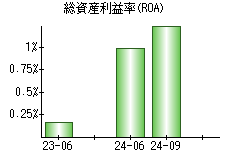
【見方】一般に、経営状態が良い会社はグラフが右肩上がりになります。
| 決算年月日 | 2023年6月30日 | 2024年3月31日 | 2024年6月30日 | 2024年9月30日 | 2024年12月31日 |
|---|---|---|---|---|---|
| 現預金等 | 4,137 | - | 7,233 | 7,021 | 6,236 |
| 利益剰余金 | 127 | - | 682 | 902 | 1,215 |
| 売上高 | 479 | - | 1,002 | 1,040 | - |
| 当期純利益 | 28 | - | 177 | 220 | - |
| 営業活動によるキャッシュフロー | 0 | - | 352 | - | - |
| 総資産利益率(ROA) | 0.16% | -% | 0.98% | 1.25% | -% |
※単位:百万円
PR
- 検索
- 業種別業績ランキング