 エスポア
【名証ネクスト:3260】「不動産業」
エスポア
【名証ネクスト:3260】「不動産業」
 へ投稿
へ投稿
主な指標
【見方】一般に、経営状態が良い会社はグラフが右肩上がりになります。
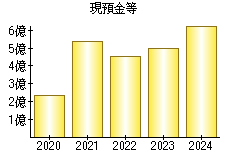
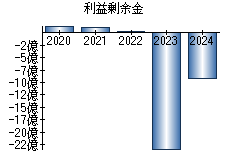
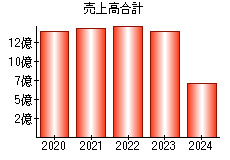
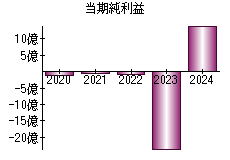
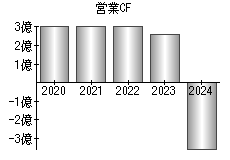
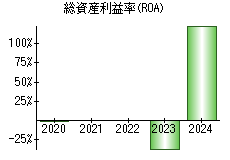
| 決算年月日 | 2020年2月29日 | 2021年2月28日 | 2022年2月28日 | 2023年2月28日 | 2024年2月29日 |
|---|---|---|---|---|---|
| 現預金等 | 233 | 540 | 452 | 495 | 630 |
| 利益剰余金 | 155 | 100 | 23 | -2,336 | -914 |
| 売上高 | 1,397 | 1,436 | 1,484 | 1,395 | 708 |
| 当期純利益 | -106 | -56 | -77 | -2,360 | 1,421 |
| 営業活動によるキャッシュフロー | 310 | 303 | 308 | 258 | -358 |
| 総資産利益率(ROA) | -1.17% | -0.62% | -0.88% | -37.61% | 124.56% |
※単位:百万円
PR
- 検索
- 業種別業績ランキング