 イメージ・マジック
【東証グロース:7793】「その他製品」
イメージ・マジック
【東証グロース:7793】「その他製品」
 へ投稿
へ投稿
主な指標
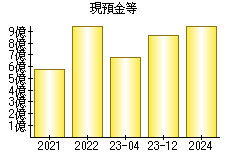
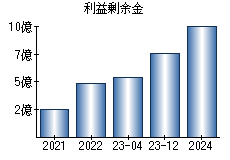
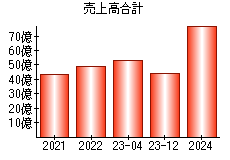
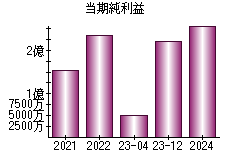
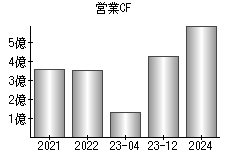
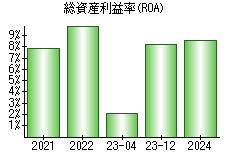
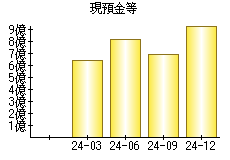
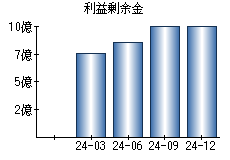
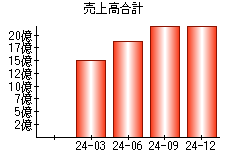
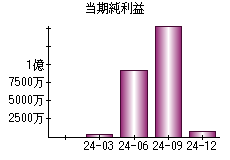
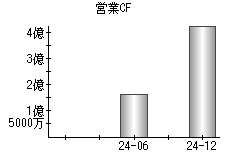
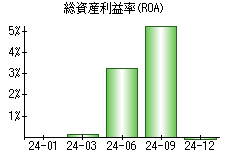
【見方】一般に、経営状態が良い会社はグラフが右肩上がりになります。
| 決算年月日 | 2021年4月30日 | 2022年4月30日 | 2023年4月30日 | 2023年12月31日 | 2024年12月31日 |
|---|---|---|---|---|---|
| 現預金等 | 574 | 956 | 680 | 862 | 941 |
| 利益剰余金 | 252 | 487 | 536 | 756 | 1,015 |
| 売上高 | 4,330 | 4,897 | 5,292 | 4,377 | 7,767 |
| 当期純利益 | 153 | 234 | 49 | 220 | 259 |
| 営業活動によるキャッシュフロー | 359 | 352 | 131 | 425 | 592 |
| 総資産利益率(ROA) | 7.87% | 9.95% | 2.10% | 8.21% | 8.56% |
※単位:百万円
PR
- 検索
- 業種別業績ランキング