 アマテイ
【東証スタンダード:5952】「金属製品」
アマテイ
【東証スタンダード:5952】「金属製品」
 へ投稿
へ投稿
主な指標
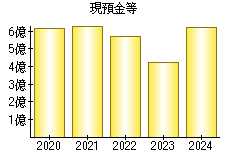
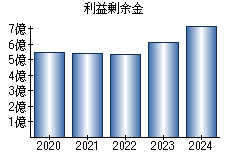
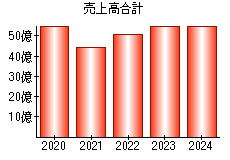
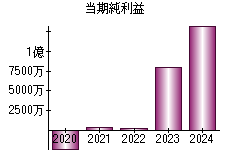
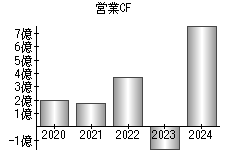
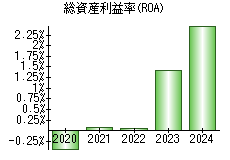
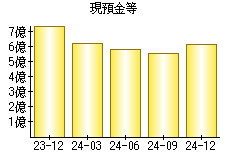
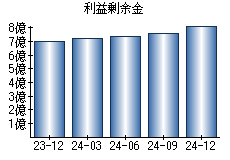
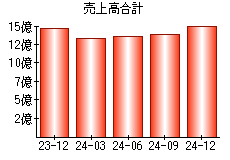
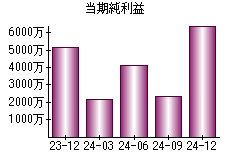
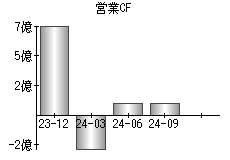
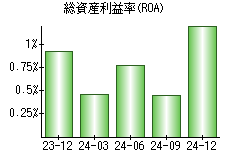
【見方】一般に、経営状態が良い会社はグラフが右肩上がりになります。
| 決算年月日 | 2020年3月31日 | 2021年3月31日 | 2022年3月31日 | 2023年3月31日 | 2024年3月31日 |
|---|---|---|---|---|---|
| 現預金等 | 616 | 636 | 569 | 422 | 622 |
| 利益剰余金 | 545 | 537 | 534 | 607 | 723 |
| 売上高 | 5,439 | 4,401 | 5,085 | 5,485 | 5,534 |
| 当期純利益 | -23 | 4 | 2 | 80 | 133 |
| 営業活動によるキャッシュフロー | 193 | 175 | 368 | -166 | 762 |
| 総資産利益率(ROA) | -0.43% | 0.08% | 0.04% | 1.42% | 2.49% |
※単位:百万円
PR
- 検索
- 業種別業績ランキング