 アップコン
【名証ネクスト:5075】「建設業」
アップコン
【名証ネクスト:5075】「建設業」
 へ投稿
へ投稿
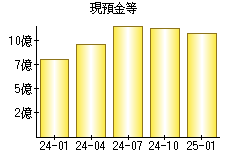
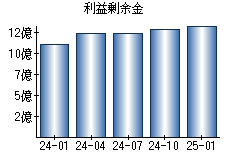
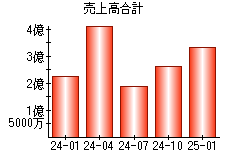
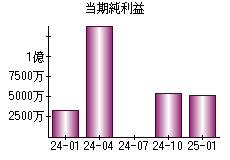
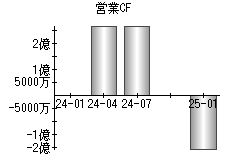
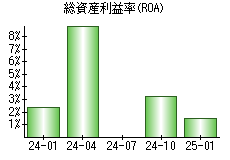
主な指標
【見方】一般に、経営状態が良い会社はグラフが右肩上がりになります。
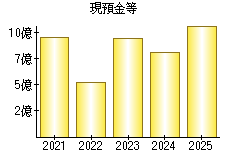
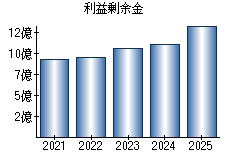
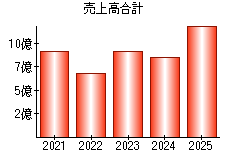
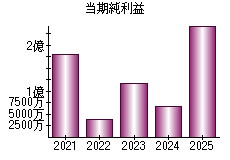
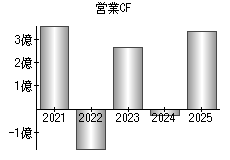
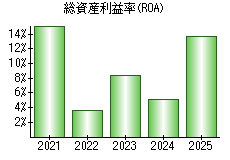
| 決算年月日 | 2021年1月31日 | 2022年1月31日 | 2023年1月31日 | 2024年1月31日 | 2025年1月31日 |
|---|---|---|---|---|---|
| 現預金等 | 956 | 519 | 942 | 806 | 1,073 |
| 利益剰余金 | 927 | 949 | 1,058 | 1,105 | 1,335 |
| 売上高 | 914 | 673 | 917 | 852 | 1,195 |
| 当期純利益 | 181 | 38 | 116 | 68 | 245 |
| 営業活動によるキャッシュフロー | 360 | -171 | 264 | -26 | 334 |
| 総資産利益率(ROA) | 15.27% | 3.59% | 8.34% | 5.06% | 13.64% |
※単位:百万円
PR
- 検索
- 業種別業績ランキング