 アイキューブドシステムズ
【東証グロース:4495】「情報・通信業」
アイキューブドシステムズ
【東証グロース:4495】「情報・通信業」
 へ投稿
へ投稿
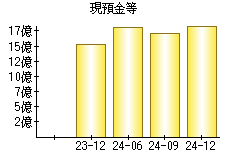
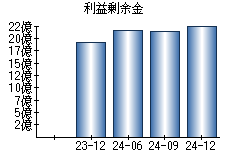
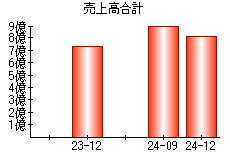
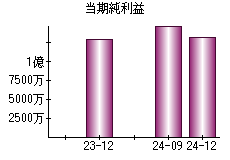
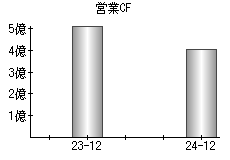
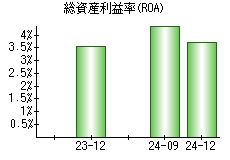
主な指標
【見方】一般に、経営状態が良い会社はグラフが右肩上がりになります。
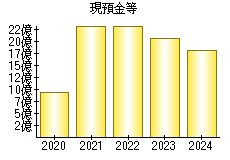
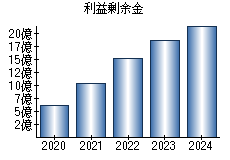
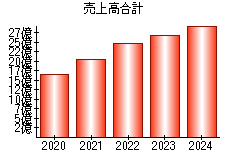
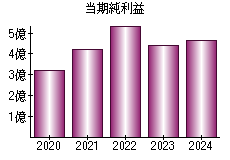
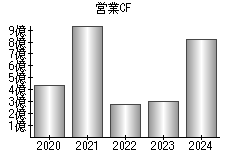
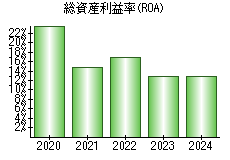
| 決算年月日 | 2020年6月30日 | 2021年6月30日 | 2022年6月30日 | 2023年6月30日 | 2024年6月30日 |
|---|---|---|---|---|---|
| 現預金等 | 931 | 2,306 | 2,337 | 2,056 | 1,813 |
| 利益剰余金 | 605 | 1,025 | 1,514 | 1,851 | 2,158 |
| 売上高 | 1,641 | 2,029 | 2,454 | 2,665 | 2,949 |
| 当期純利益 | 318 | 420 | 539 | 440 | 463 |
| 営業活動によるキャッシュフロー | 436 | 945 | 276 | 301 | 823 |
| 総資産利益率(ROA) | 23.80% | 14.84% | 16.84% | 12.95% | 12.84% |
※単位:百万円
PR
- 検索
- 業種別業績ランキング