 くろがね工作所
【東証スタンダード:7997】「その他製品」
くろがね工作所
【東証スタンダード:7997】「その他製品」
 へ投稿
へ投稿
主な指標
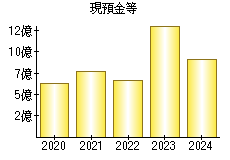
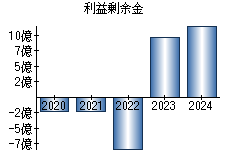
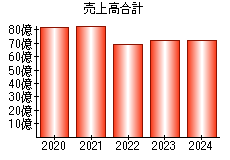
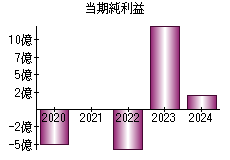
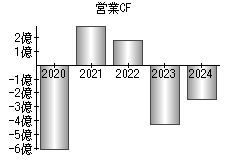
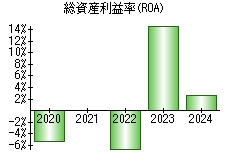
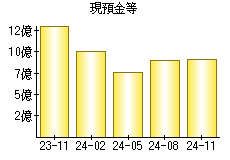
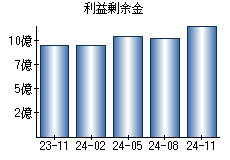
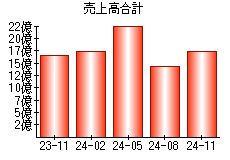
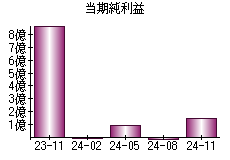
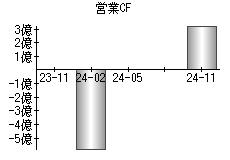
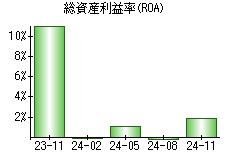
【見方】一般に、経営状態が良い会社はグラフが右肩上がりになります。
| 決算年月日 | 2020年11月30日 | 2021年11月30日 | 2022年11月30日 | 2023年11月30日 | 2024年11月30日 |
|---|---|---|---|---|---|
| 現預金等 | 630 | 775 | 659 | 1,315 | 908 |
| 利益剰余金 | -235 | -240 | -836 | 953 | 1,162 |
| 売上高 | 8,218 | 8,374 | 6,921 | 7,181 | 7,204 |
| 当期純利益 | -508 | -5 | -566 | 1,215 | 209 |
| 営業活動によるキャッシュフロー | -604 | 290 | 181 | -428 | -249 |
| 総資産利益率(ROA) | -5.29% | -0.06% | -6.64% | 14.81% | 2.60% |
※単位:百万円
PR
- 検索
- 業種別業績ランキング