 幸和製作所
【東証スタンダード:7807】「その他製品」
幸和製作所
【東証スタンダード:7807】「その他製品」
 へ投稿
へ投稿
主な指標
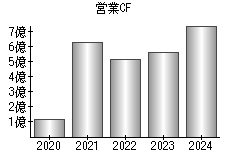
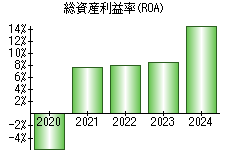
【見方】一般に、経営状態が良い会社はグラフが右肩上がりになります。
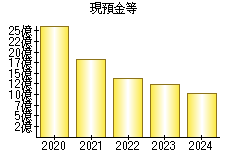
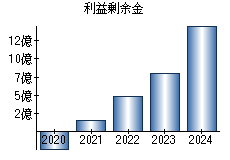
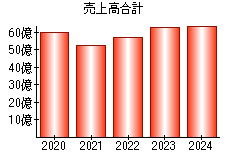
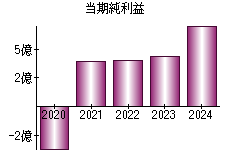
| 決算年月日 | 2020年2月29日 | 2021年2月28日 | 2022年2月28日 | 2023年2月28日 | 2024年2月29日 |
|---|---|---|---|---|---|
| 現預金等 | 2,639 | 1,834 | 1,375 | 1,239 | 1,022 |
| 利益剰余金 | -235 | 154 | 486 | 804 | 1,466 |
| 売上高 | 5,992 | 5,215 | 5,717 | 6,269 | 6,404 |
| 当期純利益 | -367 | 389 | 401 | 438 | 710 |
| 営業活動によるキャッシュフロー | 117 | 629 | 517 | 558 | 742 |
| 総資産利益率(ROA) | -5.82% | 7.66% | 7.97% | 8.50% | 14.75% |
※単位:百万円
PR

- 検索
- 業種別業績ランキング